
Nutritional labels on menus lead to healthier choices, cutting calories by up to 25%
In a recent study published in the journal JAMA Network Open, researchers used long-term (nine years) data from fast food restaurants (Taco Bell) across the United States to investigate if nutritional composition labels in menus would alter consumers’ dietary choices. The study comprised 2,329 unique restaurants and case-control comparison cohorts of 474 menu labeling and 474 non-labeling outlets. Their findings reveal that nutritional menu labeling resulted in a 22-25% reduced calories-per-transaction across restaurants. These results validate the benefits of the United States Patient Protection and Affordable Care Act of 2010, which mandated nutritional labels in restaurant chains and highlights that consumers alter their dietary intakes/make informed, healthy choices when presented with menu labels.
Study: Menu Labeling and Calories Purchased in Restaurants in a US National Fast Food Chain. Image Credit: Chubykin Arkady / Shutterstock
Calorie labeling
Calorie labeling is a strategy wherein the nutritional information of products, especially their calorific values, is included on the packaging of foods and beverages. This strategy is designed to inform and support consumers’ ability to evaluate the healthfulness of labeled products, thereby allowing consumers to make informed decisions about which items to purchase and which to avoid. Primarily used in the retail food and beverage environment, labels have increasingly become legally mandated in countries worldwide.
Research has supported product labeling as a potential means of population-level reductions in calorific intakes, thereby resulting in positive health outcomes such as lowered risk of cardiovascular diseases (CVDs) and weight abnormalities. Building upon the successes of labels on retail food packaging, the United States (US) Patient Protection and Affordable Care Act of 2010 made it mandatory for food chains and restaurants with more than 20 outlets to list the nutritional value of their menu items by 2018. Encouragingly, numerous States in the US implemented the clauses of the Act prior to its national rollout.
Despite scientific efforts to evaluate the outcomes of this early restaurant label adoption, lack of standard methodology and small sample sizes have presented confounding outcomes – some studies have found small reductions in calories-per-transaction, while others have found no association between menu labels and consumer calorific intakes.
Furthermore, prior research’s location-specificity and short study duration have resulted in difficulties in outcome generalization. A large and long-term study would help set these confounds to rest and provide policymakers and consumers, both for the US and other nations, the information needed when taking their next steps in the ongoing fight against poor diet choices.
About the study
In the present study, researchers used long-term (nine years) transactional sales data from 1,280 restaurants belonging to the Taco Bell chain. Using a quasi-experimental methodological design, they compared calorie-per-transaction values from restaurants mandated to reveal (label) their menu’s nutritional values to those that never implemented menu labeling. Study methodology and results reporting were carried out in accordance with the Strengthening the Reporting of Observational Studies in Epidemiology (STROBE) reporting guidelines.
Researchers began by identifying and collecting data from all 10,575 Taco Bell branches across the US (both open and closed) between 2007 and 2014. This data represented 5.33 billion transactions, which were subsequently trimmed based on study requirements, namely, a 1:1 comparison between outlets that listed the nutritional values of their menus and outlets with the same menu but did not publicize their nutritional values. The former (case) cohort comprised outlets in the States of California, Vermont, and Maine, along with seven counties and two cities, and included a total of 474 outlets. The latter (control) cohort was synthetically matched to mirror the case group as closely as possible across both menu- and community-level characteristics.
“In the final analytic sample, comparison restaurants were located in 878 counties in 35 states. Our primary outcome was mean calories per transaction and secondary outcomes included grams of total fat, carbohydrates, protein, saturated fat, sugar, and dietary fiber, and milligrams of sodium.”
The MenuStat nutritional database was used to identify 3,517 unique menu items based on their nutritional values. Statistical analyses consisted of 2-ways fixed effects regression models used to compare outcomes between case and control restaurants. Since most (94%) of sampled restaurants were located in the State of California, heterogeneity analyses were conducted in Californian versus non-Californian restaurants.
Study findings
“The final sample size was 2329 unique restaurants and 31 468 restaurant-month observations, with 474 restaurants in the menu labeling group and 474 synthetic control units.”
This study revealed that at baseline, the mean calories-per-transaction of case restaurants was 1035 while that of controls was 1056. During follow-up assessments, progressive reductions in calories-per-transaction were noted for case restaurants, ranging from 21.9% (3-month follow-up) to 25.0% (at 24 months).
Differences in customer responses were observed by region, with Californian restaurants depicting much larger case versus control differences than non-Californian outlets. Interestingly, the degree of calorific difference was found to vary by the time of day, with the morning hours presenting the highest calories-per-transaction differences between cases and controls and no statistically significant differences in the late evening and night hours.
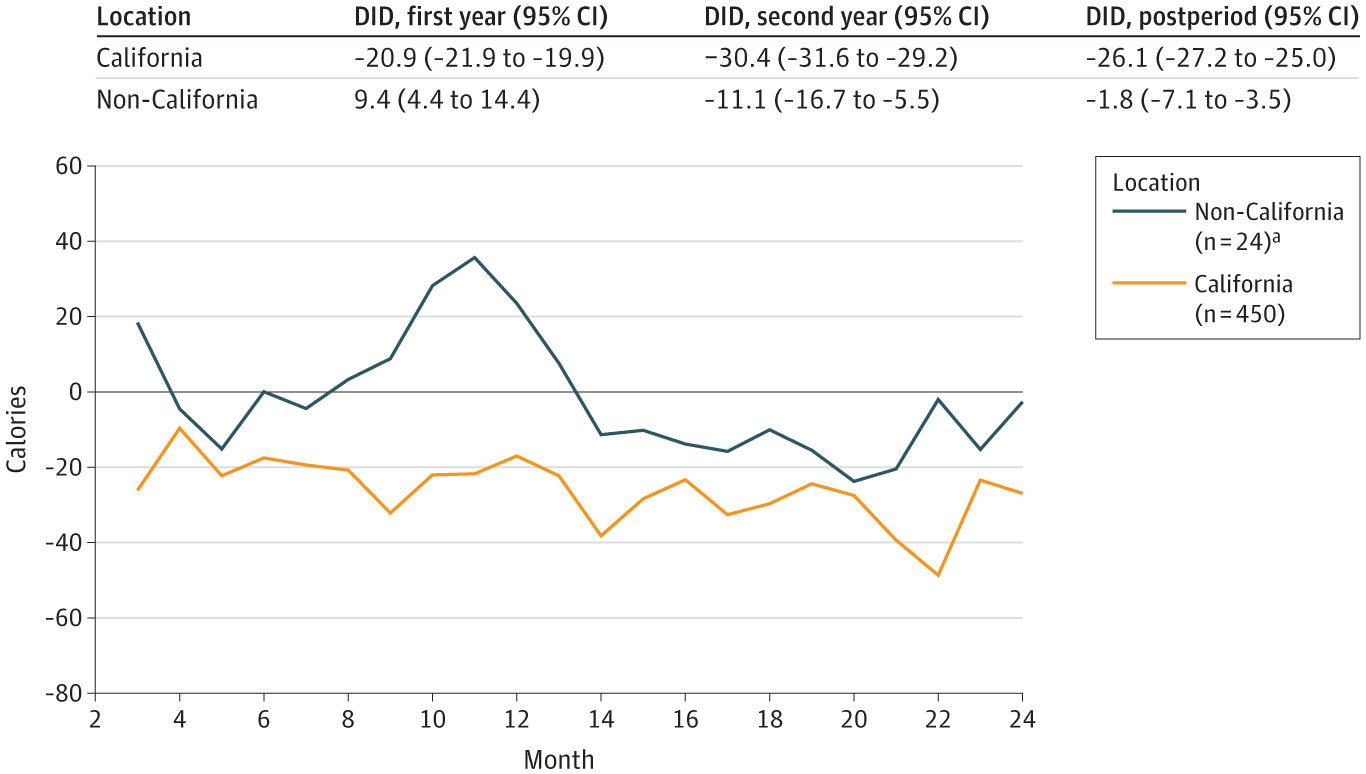
Difference-in-Differences (DID) Estimates of Calories Purchased per Transaction After Implementation of Menu Labeling, by Location
Conclusions
The present study represents the longest-term and most extensive scale comparison of consumer responses to menu labeling in the United States and potentially the world. A direct comparison between 474 menu-labeling restaurants and 474 non-menu-labeling restaurants revealed that, on average, consumers reduced their calories-per-transaction by 25% when provided with the nutritional value of their potential food purchases. These findings support the legislature’s call for the mandatory labeling of menus in restaurants and have the potential to guide policy that might contribute to reductions in global diet-associated comorbidities, including CVD and obesity.