
Warming Trends: Penguins in Trouble, More About the Dead Zone and Does Your Building Hold Climate Secrets?
SCIENCE
March of the Penguins Heads Toward Extinction
Emperor penguin populations are mostly healthy and strong, at the moment. But climate change threatens to drive these sea ice-dependent birds to extinction by the end of the century. Because of global warming, they could soon become the latest species to be listed under the Endangered Species Act.
Research has shown that populations could decline by 47 percent by 2050 if greenhouse gas emissions continue at current levels, and could be virtually eliminated by 2100. The birds breed and raise their chicks on thick Antarctic sea ice, but ice in some areas has declined by 60 percent, and ice melt is projected to quickly increase throughout the century.
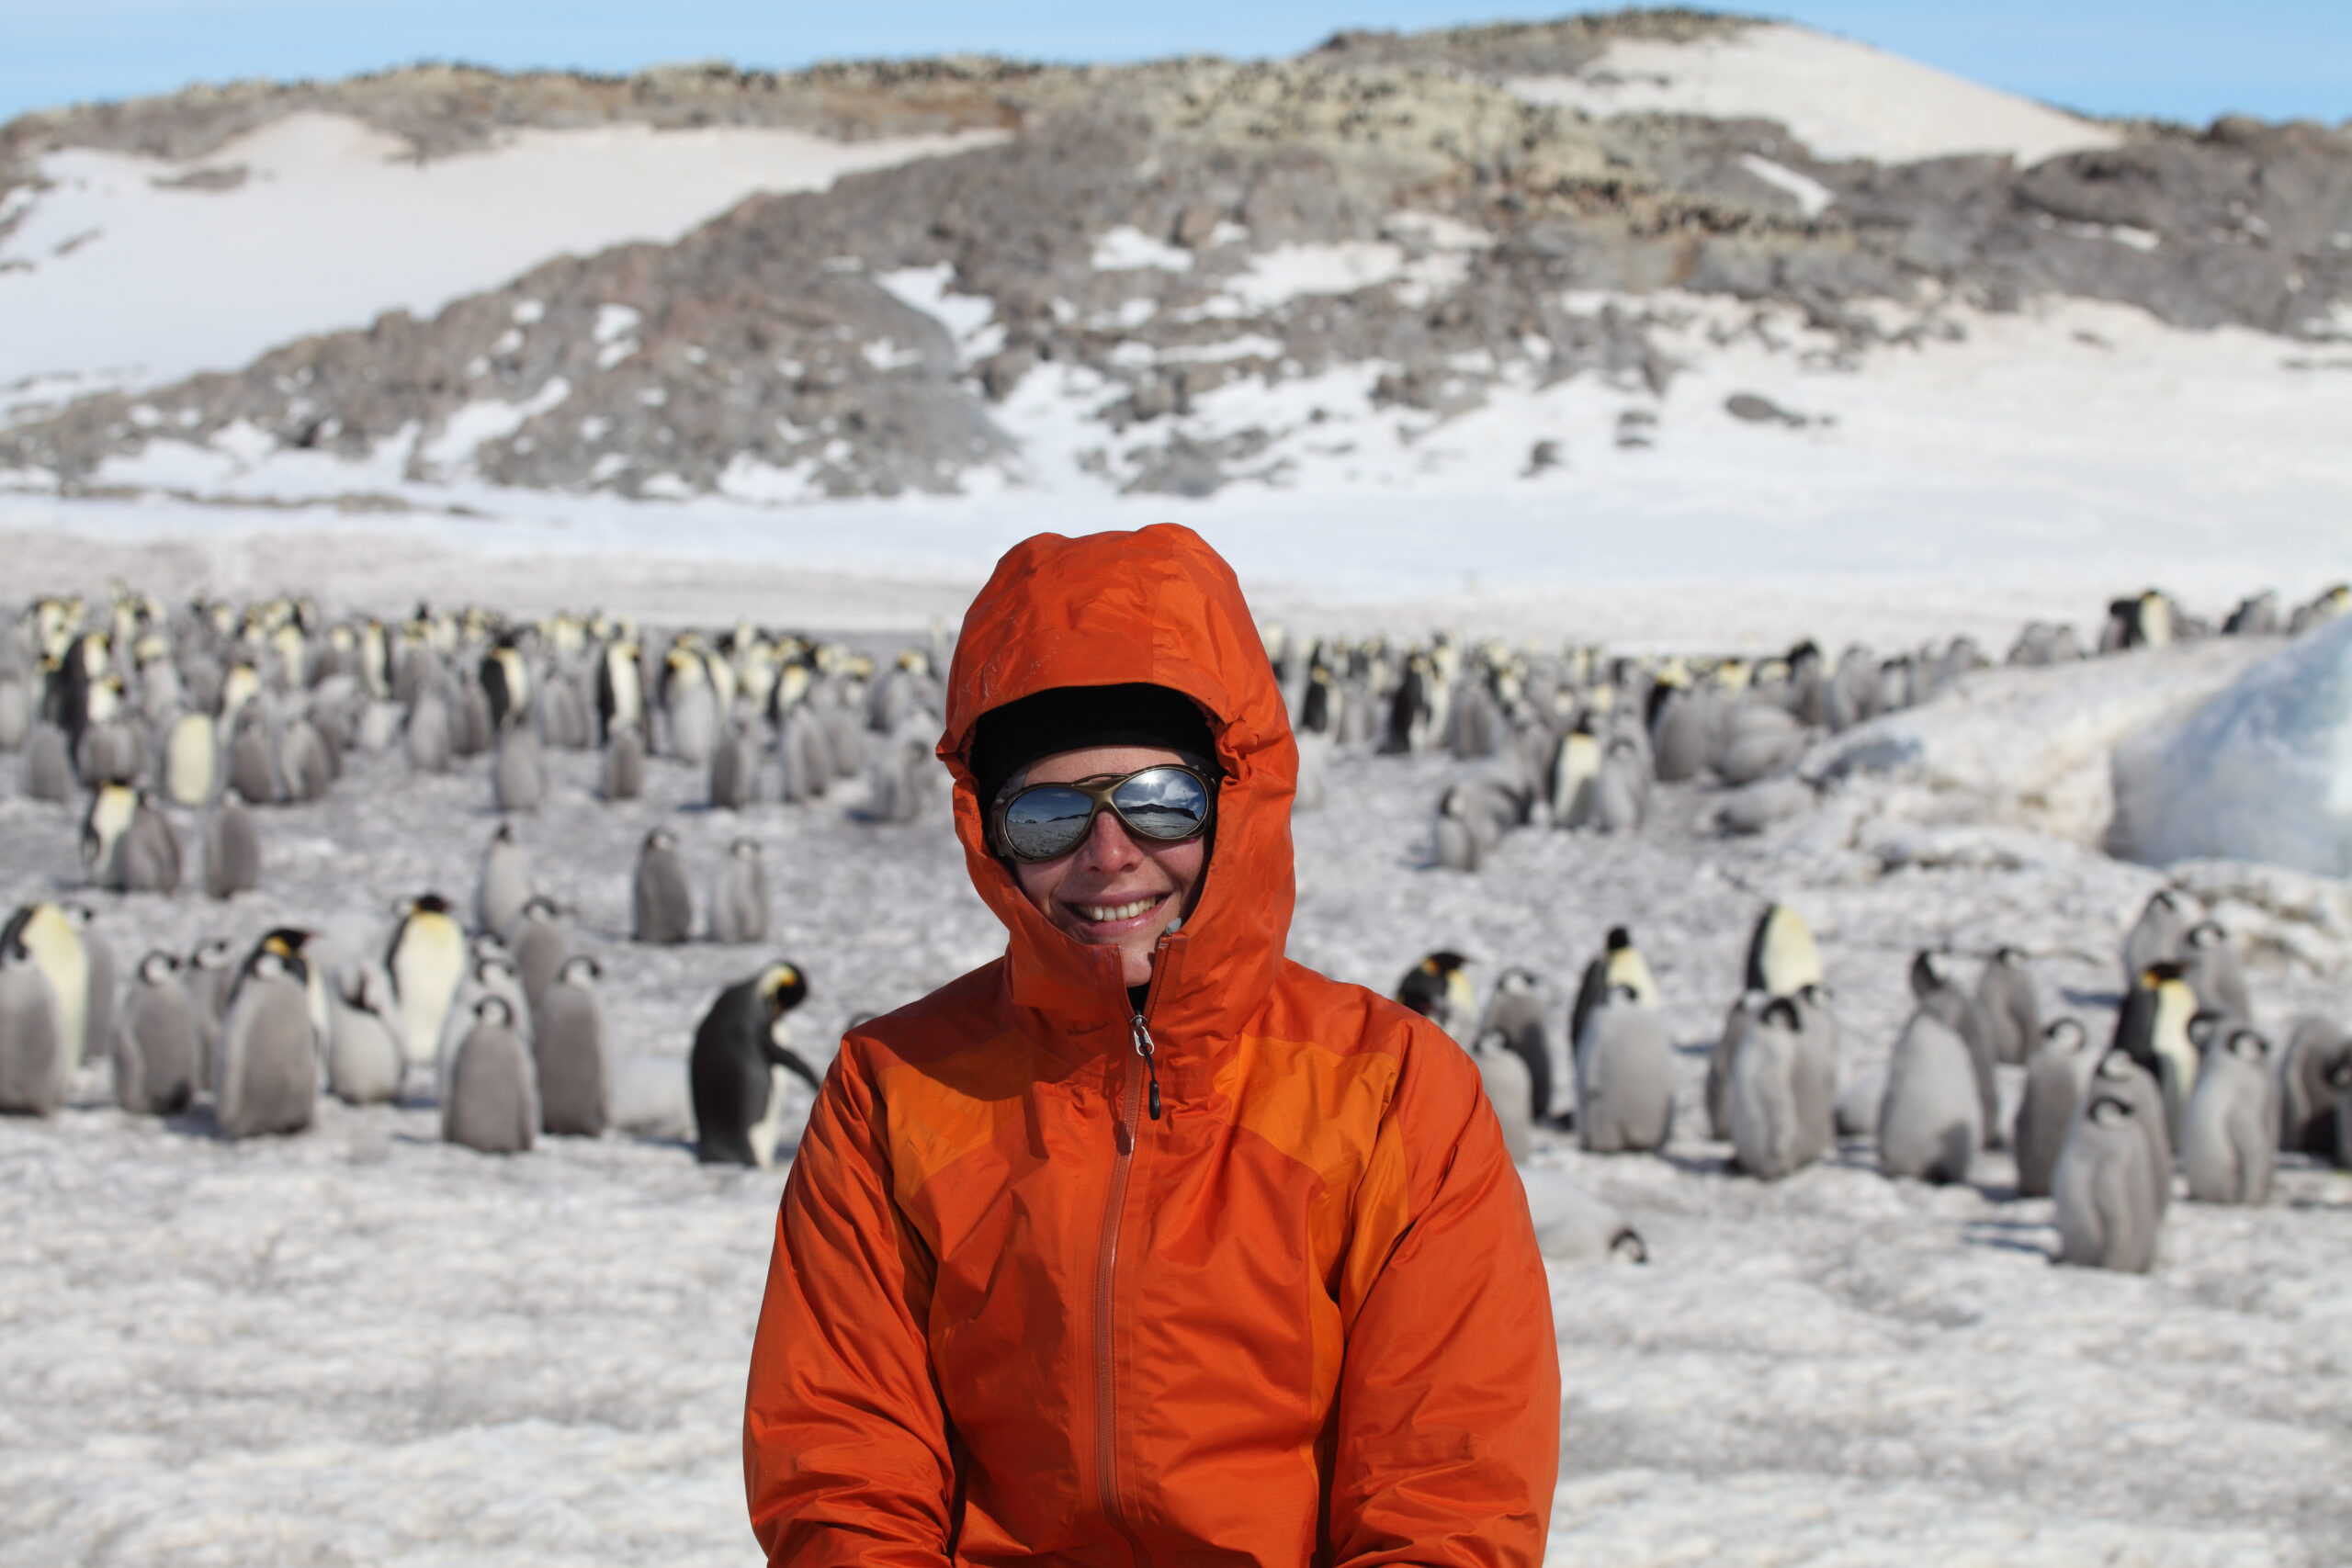
Stephanie Jenouvrier, a seabird ecologist at Woods Hole Oceanographic Institution, has spent decades researching emperor penguins, and her work, including a study published in Global Change Biology this week, has informed the Fish and Wildlife Service’s proposal to list the species as “threatened” under the ESA.
The study found that 98 percent of emperor penguin colonies could be quasi-extinct by 2100— meaning the population would be reduced to a point where it could not recover—under a business-as-usual warming scenario, where temperatures rose to 4.3 degrees Celsius above pre-industrial levels by 2100. But if temperature rise is limited to 1.5 to 2 degrees Celsius, goals set by the Paris Climate Agreement, enough sea ice is likely to remain in Antarctica that the species has hope of survival.
“The main threat for emperor penguins is climate change, so if we don’t reduce our greenhouse gas emissions, the species is going to go to extinction,” Jenouvrier said.
SCIENCE
The Understory: Old Wood Tells Climate Secrets
Inside aging buildings across New York City are millions of cubic meters of wood from old growth trees that once dominated the eastern United States. The forests were demolished to make way for cities and roads, but their skeletons still exist as slabs, joists and beams in old buildings that sit alongside modern, steel-framed skyscrapers.
Dendrochronologists—also known as tree ring scientists—sometimes get called to consult at sites where these old structures are being remodeled or taken down. One recent project brought researchers from the tree ring laboratory at Columbia University’s Lamont-Doherty Earth Observatory to the site of the Terminal Warehouse in Manhattan’s Chelsea neighborhood, an 1891 structure that has served as many things, including a nightclub, a movie set and a mini storage facility.
The warehouse was built with massive planks of longleaf pine—a species that once covered the southeastern United States. Using the tree rings like a barcode, the researchers cross-referenced them with an enormous database of U.S. tree ring data to find the precise location where the trees grew. They were able to confirm not only that the wood was cut in the late 1800s to construct the warehouse, but also that the trees were probably harvested near the Alabama-Georgia border, and that many dated back to the 1600s and some even earlier.
Tree rings don’t just hold information about the buildings that they’re found in. They also contain untapped data about the forests that once dominated the American landscape before settlers arrived.
“Because so much of the eastern United States was deforested, it can help extend our records in places where we currently would not have any records,” said Mukund Palat Rao, a postdoctoral researcher at Columbia’s tree ring lab. “It’s helping us fill out the climate history of the region in a way that you cannot do now because those forests don’t exist.”
From tree rings, researchers can extract climate data dating back centuries, before temperatures were first recorded, around the turn of the 20th century. Narrow rings indicate hot, dry years when the tree didn’t grow much; wide rings indicate mild years with lots of rain, Rao said. Some trees even have fire scars that indicate when and where forest fires occurred.
“We have a network of tree ring data, but there are gaps in terms of information we have for climate spatially,” said Caroline Leland, a postdoctoral fellow at Columbia’s tree ring lab. “If we can figure out where this wood came from, then we may be able to fill in some of the gaps of that network and have a better understanding not only of how climate changed over time, but also how it varies over space.”
SCIENCE
‘Flooding is a Social Issue’
At least 58 million people moved into regions that experienced flooding between 2000 and 2015, a new study analyzing data from satellites that observed floods as they occurred has found.
The study, published this week in Nature, used satellite imagery to examine 913 floods between 2000 and 2018. The study authors, from Columbia University and the University of Arizona, found that while the world population increased by 18 percent from 2000 to 2015, the population in flood zones increased by 34 percent, a trend that is expected to continue as climate change makes floods more common.
Similar studies in the past have used flood models to calculate the risk that an area will flood, based on factors like elevation and waterways, said co-author Jonathan Sullivan, a postdoctoral research scientist at the University of Arizona. But this study used satellites to monitor actual floods when and where they occurred, painting a different picture of which areas are prone to floods.
“What we did differently was we said well, how about we put flood models aside for a moment, despite the fact that they’re really useful and definitely a cornerstone in understanding floods, and let’s look at satellites,” Sullivan said.
One factor that flood models often miss out on is the effect of dams on floods. A significant proportion of the people who experience floods are exposed as a result of dam breaks, even though dams cause just 2 percent of floods.
Keep Environmental Journalism Alive
ICN provides award-winning, localized climate coverage free of charge and advertising. We rely on donations from readers like you to keep going.
You will be redirected to ICN’s donation partner.
Sullivan said this is most significant in developing countries where there is less funding for flood prevention and adaptation and people are more vulnerable.
“I think a lot of people point to climate when they see floods, and sort of climate as being a big driver of flood events and a big driver of the impacts of floods, and I definitely don’t disagree with that,” he said. “But I think what our data really shows is that flooding is a social issue.”
SCIENCE
Dead Zone Status Report
This year’s dead zone in the Gulf of Mexico—an expanse of water that contains little to no oxygen, where marine plants and animals can’t survive—measured 6,334 square miles, slightly larger than the average size of 5,380 square miles at the peak in mid-summer.
The National Oceanic and Atmospheric Administration released its annual measurement during the peak of the dead zone this week. The low oxygen conditions, known as “hypoxia,” occur because of nutrients that discharge into the Gulf from the Mississippi River, largely from agricultural runoff in the states bordering the river. These nutrients fuel algal blooms that deplete oxygen from the water in the summer, until wind and storms churn the waters through the autumn, and oxygen levels increase.
Most organisms cannot survive in the dead zone, which has consequences for ecosystems and the fisheries that operate within them, said David Kidwell, director of the competitive research program at NOAA’s National Center for Coastal Ocean Science.
“That’s habitat loss. That’s an area where if you’re a shrimp or you’re a fish, you likely aren’t going,” he said. “That’s sort of a fundamental ecosystem impact that’s occurring because of the dead zone. They just can’t go there.”
States in the Mississippi River watershed, along with federal agencies like NOAA, have been working for several years to reduce the amount of nutrients flowing into the Mississippi River, with a goal of reducing the dead zone to an average of just 1,900 square miles by 2035. But climate change is likely to make these efforts harder, Kidwell said.
Warmer waters that will occur as the planet warms hold less oxygen than colder waters. And marine life will likely be more physiologically strained by warmer temperatures, demanding more oxygen to keep up with their metabolic needs. Plus, climate change may cause regions in the MIssissippi River watershed to see more rain and snowfall, leading to more water washing more nutrients into the Gulf of Mexico.
“This is a large-scale issue,” Kidwell said. “This is not a fix-it-in-a-couple-years issue, this is a decades-long issue.”
CULTURE
Working Out for Climate Action
It sometimes feels as though there‘s not much a single individual can do to address the enormity of the climate crisis. But a fitness app is encouraging users to channel their workout habits toward solidarity with those bearing the worst of the crisis.
Strava is challenging people to exercise for a total of 100 minutes between Aug. 16 and Aug. 31 as part of World Humanitarian Day, an annual event held by the United Nations humanitarian office to honor humanitarian workers. This year, the UN event is focused on how climate change, in the form of droughts, heat waves and wildfires, is devastating communities around the world and challenging humanitarian efforts in those places.
By participating in the Strava challenge, people can contribute to the call for developed countries to fulfill their promise to contribute $100 billion annually for developing nations to prepare for climate change. Countries are falling short of this goal by an average of $20 billion a year.
People who are unable to meet the exercise goal can still make their voice heard in this campaign by signing a pledge calling on world leaders to contribute.

Web Producer, St. Paul
Katelyn Weisbrod is a reporter and web producer for Inside Climate News based in Minnesota. She writes ICN’s weekly Warming Trends column highlighting climate-related studies, innovations, books, cultural events and other developments from the global warming frontier. She joined the team in January 2020 after graduating from the University of Iowa with Bachelor’s degrees in journalism and environmental science. Katelyn previously reported from Kerala, India, as a Pulitzer Center student fellow, and worked for over four years at the University of Iowa’s student newspaper, The Daily Iowan.


